


I've spent a lot of time on the road this year, and have had the great fortune of meeting many people who are getting started with web programming on IBM i. I've been asked several times how to debug web applications. After all, people like me have been developing RPG applications for decades, but not web applications... Are there tools for debugging things on the web side like there are for RPG? Yes, of course... and in this blog entry, I will tell you about two of my favorites.
Both of the tools I discuss here are add-ons for the Firefox web browser. Although similar tools also exist for other browsers, I truly believe that Firefox has the best tools available for debugging applications. Even when working in a shop that has chosen to standardize on a different browser, I will use Firefox for development, and then switch back to Chrome or Internet Explorer when showing it to the customer.
Without further ado, here are my favorite Firefox add-ons for debugging web applications:
Web Developer Toolbar
https://addons.mozilla.org/en-US/firefox/addon/web-developer/
The Web Developer Toolbar by Chris Pederick provides a toolbar with a multitude of tools to assist with debugging web applications. Personally, I find two particular tools very helpful when developing web applications:
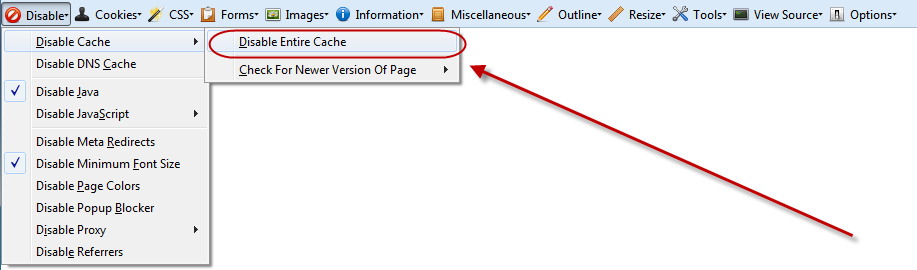
1. Disable Entire Cache
If you are like me, you make changes small changes, test them, then repeat the process of making more changes, and testing them, etc. Since a web browser normally caches these files to improve performance, you have to clear your browser's cache with each change, which can be tedious. Even worse, if you forget to clear the cache, you may end up frustratedly trying to figure out why your fix didn't work, only to eventually discover that you weren't running the latest version of the code. To help with this problem, the Web Developer Toolbar has an option to Disable the Entire Cache.
Of course, once you've finished developing, you'll want to un-check the Disable Entire Cache option so you can once again take advtange of the improved performance the cache provides.
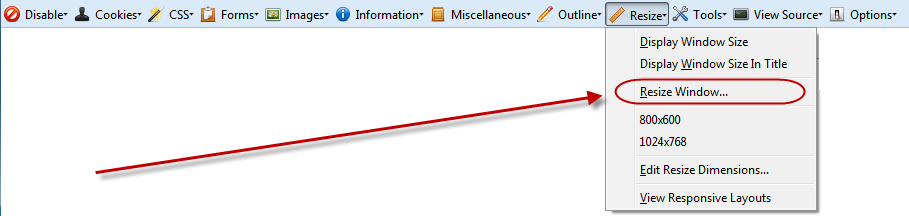
2. Resize Window
In the green-screen environment, there were only two possible screen sizes (80x24 and 132x27), however this is not true of web applications. Users have a variety of different monitor sizes and screen resolutions that they use, and you'll want to make sure that your application works nicely, even on the smallest of them.
The Web Developer Toolbar makes this easier by providing a Resize Window option that will set the browser window to any size you like. This way, you don't have to actually change your monitor's resolution when testing. Just resize your browser to the minimum size you are developing for, and make sure your application works.
Firebug
https://addons.mozilla.org/en-US/firefox/addon/firebug/
If Firefox is the best browser for developing web applications, then Firebug by the Firebug Working Group) is surely the reason. Without a doubt, Firebug is the tool that I use the most when debugging my web applications! The other browsers (Internet Explorer, Chrome and Safari) have built-in developer tools that are getting closer and closer to Firebug's capabilities with each release, but so far, Firebug is still my favorite.
There are too many tools in Firebug for me to show you all of them in this blog post, but here are the three that I think you'll find the most useful:
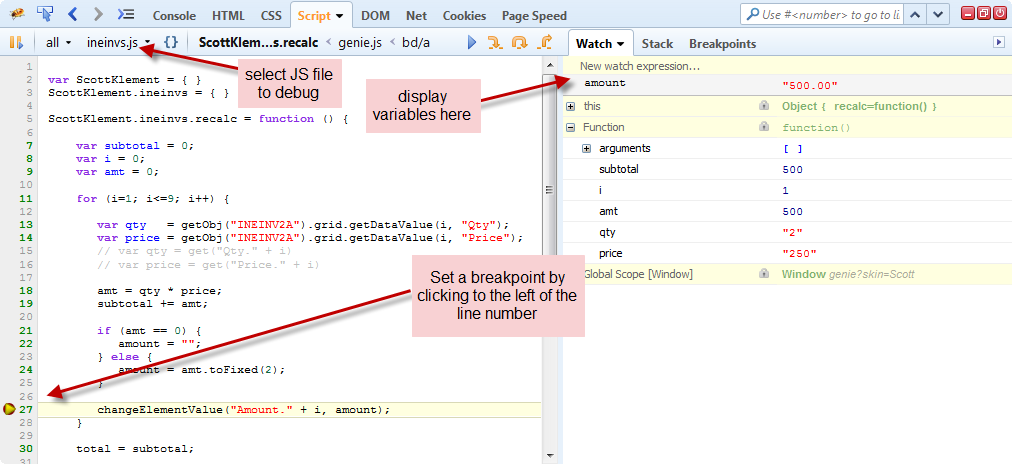
1. Debugger for JavaScript Code
Profound UI is written in JavaScript, and offers many events where you can write your own JavaScript code to customize the user experience. Other web environments, such as Profound Logic's RPGsp, or even open source environments like CGIDEV2, PHP or Ruby will almost certainly require you to write your own JavaScript code. And like any programming environment, sometimes you need a debugger to troubleshoot your code.
The Script tab in Firebug provides a full-featured debugger for JavaScript. You can set breakpoints in your code, step through the code line-by-line, and display the values of variables in the debugger. In this way, Firebug provides the same capabilities for JavaScript that the STRDBG or RDi Debugger provides for RPG.
Tip: JavaScript is much easier to debug if you write functions for your code, and put it in it's own file in the IFS. The Profound UI Session Controller will automatically load files from any subdirectory beneath /www/your-instance/profoundui/userdata/custom if they end in .js. In Genie, it's necessary to add a <script> tag that points to your JavaScript files to your start.html. In either case, once you've written your JavaScript functions, you can call those functions from screen events such as "onload", "onclick", "onchange", etc. Then, you can step through them easily and debug them from Firebug.
2. View Network Communications
When you are debugging an unexpected problem, one of the first things you'll want to do is narrow down where it's caused. For example, if a variable is displaying the wrong value, is the bug in your RPG program, or in the display file?
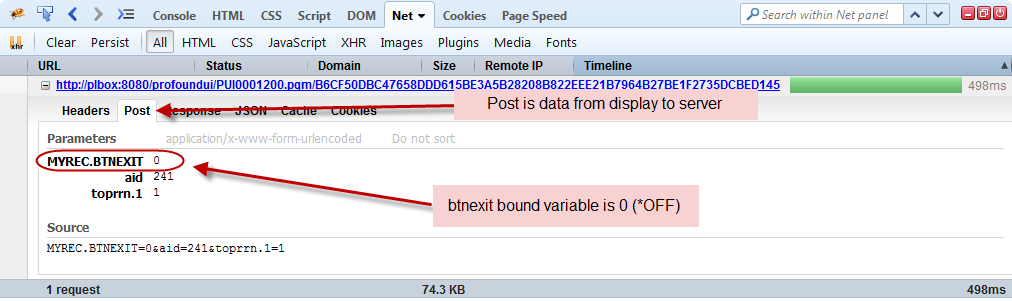
The Net tab in Firebug lets you see all of the data being sent to and from the IBM i. You can use this to see what value your display file is receiving, and which values it's sending back by looking for communications send to the following programs:
- PUI0001200 for Rich Display applications
- PUI0002110 for Genie applications
- PUI00091xx for SQL statements for database-driven components.
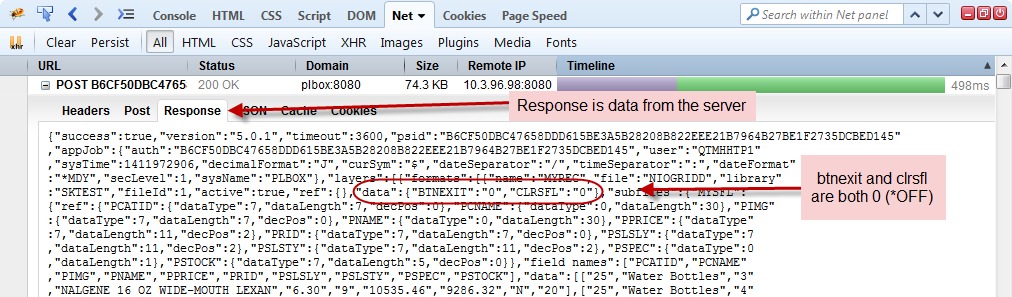
For example, here's a screenshot showing the values of the variables sent and received in a Rich Display session. The Post tab shows data sent from the display to the server, and the Response tab shows everything sent back. The response also includes all information about what to draw on the display, but the "data" section shows the variables from RPG.
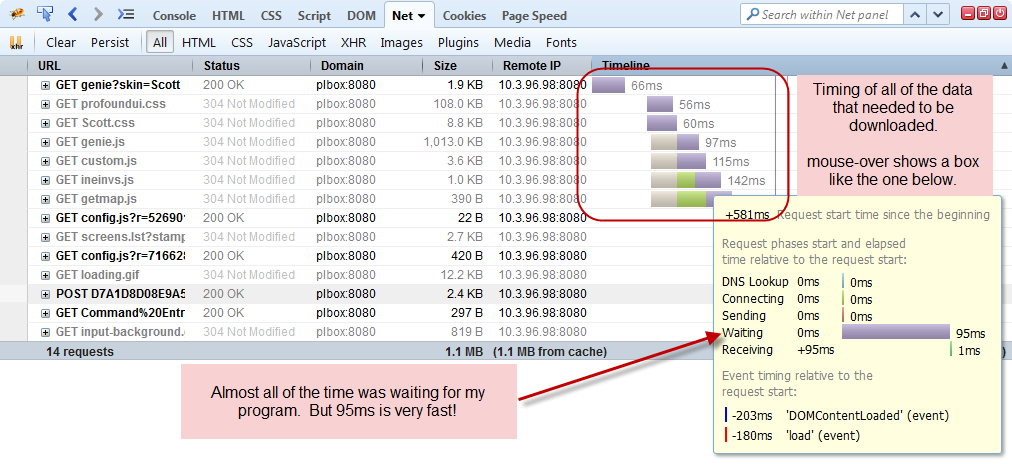
The Net tab is also a powerful tool for troubleshooting performance. As you mouse-over the different files, it'll show you how long it's taking to send the request to the server, how long it's waiting for the server-side program to run, and how long it takes to download the response.
3. Troubleshoot CSS Styling
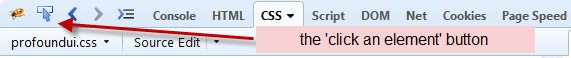
After clicking on the CSS tab in Firebug, use the "Click an element on the page" button shown below, then click any element on your display to find out where it gets it's styling from.
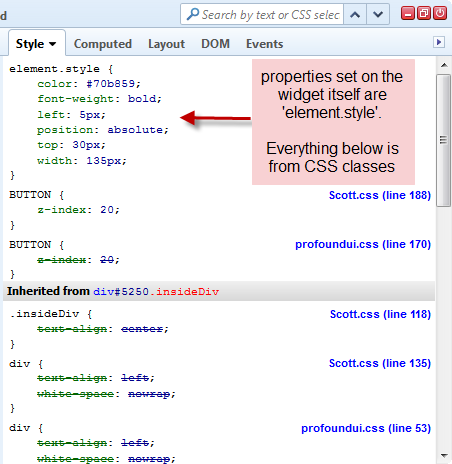
 This is very helpful when you're not sure why a certain font, color, or other styling attribute has been selected. At the top of the style display, you'll see any styling that's set directly on the element itself (by using widget properties if you are using Profound UI, or a style HTML attribute if you are coding your own page.) Beneath that will be a list of the CSS classes that apply to your element in order from the highest to lowest level of precedence. Attributes that are overridden by higher precidence classes will be shown "crossed out" to make it clear that they are not affecting the display.
Conclusion
I have barely scratched the surface of the things you can do with these two powerful debugging add-ons, but these are the ones that I use the most. Do you have a specific question of how to debug something with these tools? Visit us in the Profound Logic forums, ask for help, and I'll show you more.
Happy debugging!
